📘 Guide Complet d’Utilisation de la Plateforme FullMargin.net
Un outil tout-en-un pour les traders ambitieux, disciplinés et en quête d’excellence.
🔎 Qu’est-ce que FullMargin ?
FullMargin est une plateforme pensée pour transformer l’organisation, la psychologie et les performances du trader. Ce n’est pas un simple outil : c’est un écosystème complet pour cadrer votre trading, construire votre méthode, affiner vos décisions et développer une régularité mentale et financière. Pensée pour les trader d’abord et les webentrepreneur ensuite.
🧠 La vision de FullMargin
Le problème dans le trading n’est pas le trading en lui meme mais de sa la mauvaise comprehension que l’on en a et de l’univers de solitude dans lequel il plonge certains. FullMargin intervient comme l’écosystème qui vous permet d’être discipliné avec tout les outils dont vous avez besoin et pour vous guider là où les erreurs humaines sabotent vos gains : désorganisation, impulsivité, manque de traçabilité, isolement, etc.
Chaque fonctionnalité vise à corriger ces failles pour faire de vous un trader structuré, analytique et discipliné.
📋 Structure du Dashboard Utilisateur
Votre dashboard personnel regroupe tous vos outils d’organisation et d’exécution :
📝 1. Outil de prise de notes
Gardez une trace de vos idées, plans de trade, remarques ou réflexions. L’outil propose une hiérarchisation simple avec tags, dates et couleurs.
📌 2. Gestion des tâches
Créez vos routines journalières : analyse matinale, revue de session, journal, etc. Suivez vos engagements comme un entrepreneur suit son agenda.
📊 3. Journal de trading
Renseignez chaque position : date, actif, direction, stop, TP, gestion, erreur, émotion. Analysez vos résultats avec des graphiques automatiques et identifiez vos patterns psychologiques.
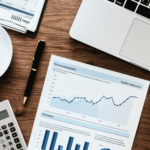
💰 4. Gestion des finances
Suivez vos revenus de trading, vos dépenses (coaching, abonnements, challenges), votre capital total, votre drawdown max et vos ratios mensuels. Restez lucide sur votre réalité financière.
🎧 5. Podcasts exclusifs
Accédez à des audios inspirants, éducatifs et méditatifs pour nourrir votre mental chaque jour. Organisés par thème : mindset, stratégie, argent, solitude, focus.
🧑🤝🧑 6. Espace communauté
Échangez avec d’autres utilisateurs. Partagez vos bilans, vos idées, vos réussites, et recevez du feedback bienveillant.
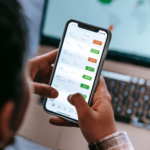
📈 7. TradingView intégré
Consultez les marchés, tracez vos zones, marquez vos setups en direct depuis le dashboard. Gain de temps + concentration optimale.
🛒 Marketplace & VPS
FullMargin propose également une marketplace contenant :
- 📚 Ebooks spécialisés
- 📊 Indicateurs & templates professionnels
- 🎓 Formations ciblées (analyse, discipline, scalping…)
- 🖥️ Serveurs VPS pour vos robots de trading 24/7
📌 Scénario d’utilisation type (routine quotidienne)
- 8h00 : écoute d’un podcast motivation / mindset
- 8h15 : check du marché avec TradingView intégré
- 8h30 : planification des tâches de la journée
- 9h00 – 12h00 : session de trading
- 12h30 : enregistrement des trades dans le journal
- 17h00 : revue mentale + notes sur la journée
- Dimanche soir : gestion finances + planning hebdo
🧩 Conclusion : FullMargin est plus qu’un outil
C’est une extension de votre discipline. Une structure mentale visible. Une mémoire pour vos erreurs. Un compagnon invisible mais redoutablement puissant.
Utilisez-le chaque jour. Ne laissez plus vos émotions gérer votre performance.